
Committee Continues Efforts to Prevent Opioid Epidemic from Harming More Americans
The House Committee on Ways and Means faced a densely packed legislative schedule throughout early 2018, balancing fiscal policy revisions with urgent public health mandates. As the primary tax-writing panel, its members were tasked with reviewing both traditional revenue streams and emergency healthcare expenditures. A significant portion of the winter sessions was dedicated to identifying state-level funding gaps, particularly those impacting rural hospital networks and community addiction centers.
During the preliminary morning sessions on February 6, lawmakers evaluated several state-level proposals aimed at bolstering local health budgets. Discussions spanned a variety of municipal revenue streams, tracking how different jurisdictions were attempting to offset the soaring costs of emergency medical responses.
Several regional representatives submitted reports detailing localized tax models used to directly fund their district recovery programs. These documents highlighted revenue captured from newly regulated entertainment sectors, tracking specific levies applied to commercial sportsbooks, any new online casino operating within state lines, and established lottery distributions. While these fiscal debates established the economic constraints facing state governments, the afternoon agenda swiftly pivoted to the clinical realities driving the crisis.
The Subcommittee on Health convened shortly after to address the escalating mortality rates that were overwhelming these local resources. Committee members required direct clinical insights to understand why current intervention strategies were failing to curb the nationwide spike in fatal overdoses.
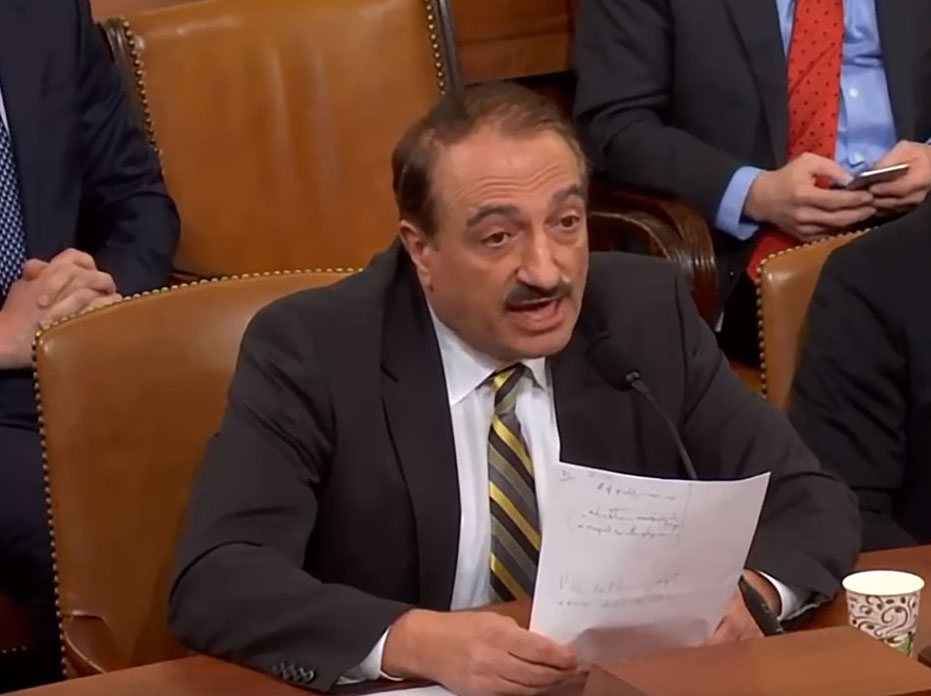
To provide this critical frontline perspective, Dr. Ramsin Benyamin testified on behalf of ASIPP before the Committee on Ways and Means, Subcommittee on Health on Tuesday, February 6, 2018 at 3:00 PM in 1100 Longworth House Office Building. His testimony sought to clarify the distinction between various categories of narcotics and their respective roles in the ongoing epidemic.
Click here for Dr. Benyamin’s full Testimony
The Following is an Excerpt from Dr. Benyamin’s Testimony:
Drug overdoses accounted for 64,000 deaths in 2016, with over 42,000 of opioid deaths, a 20% increase from 2015 from over 52,000. Increases are greatest for overdoses related to the category including illicitly manufactured fentanyl, which more than doubled, accounting for more than 20,000 overdose deaths in 2016 versus less than 10,000 deaths in 2015. This difference is enough to account for nearly all increases in drug overdose deaths from 2015 to 2016.1,2 Consequently, while fentanyl contributed to 20,000 deaths, heroin contributed to 15,000 deaths, whereas prescription drugs contributed to less than 15,000 deaths (Figs. 1-3).3,4 Deaths due to heroin were up nearly 20% and deaths from other opioids such as hydrocodone and oxycodone were up 14%. Deaths due to methadone declined; however, they still constitute an extremely high percentage with over 3,000 deaths, which is only 1% of prescriptions. As we all realize, things might very well be worse than what is shown in the data.
1 Dowell D, Noonan RK, Houry D. Underlying Factors in Drug Overdose Deaths. JAMA 2017; 318:2295-2296.
2 US Centers for Disease Control and Prevention. Provisional counts of drug overdose deaths as of August 6, 2017.
https://www.cdc.gov/nchs/data/health_policy/monthly-drug-overdose-death-estimates.pdf.
3Guy GP, Zhang K, Bohm MK, et al. Vital Signs: Changes in Opioid Prescribing in the United States, 2006-2015. MMWR Morb Mortal Wkly Rep 2017; 66:697-704.
4Ingraham C. CDC releases grim new opioid overdose figures: ‘We’re talking about more than an exponential increase.’ The Washington Post, December 21, 2017. https://www.washingtonpost.com/news/wonk/wp/2017/12/21/cdc-releases-grim-new-opioid-overdose-figures-were-talking-about-more-than-an-exponential-increase/?utm_term=.f3f893febb8b
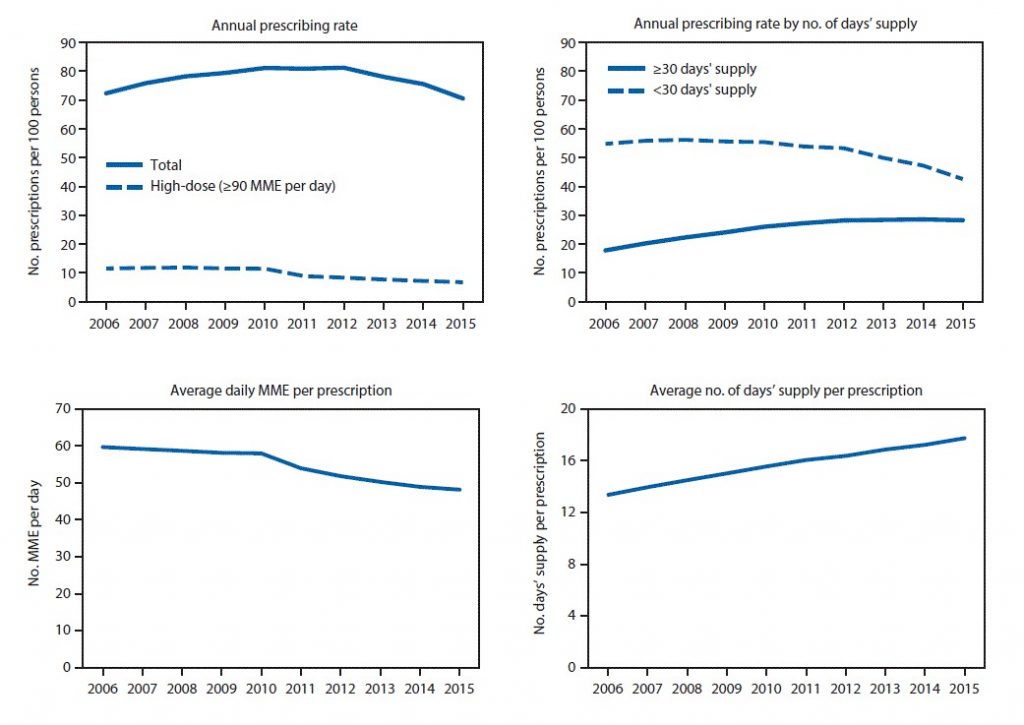
Fig. 1. Annual opioid prescribing rates, by number of days’ supply, average daily morphine milligram equivalent (MME) per prescription, and average number of days’ supply per prescription — United States, 2006–2015.
Source: Guy Jr GP, et al. Vital Signs: Changes in opioid prescribing in the United States, 2006-2015. MMWR Morb Mortal Wkly Rep 2017;66:697-704.
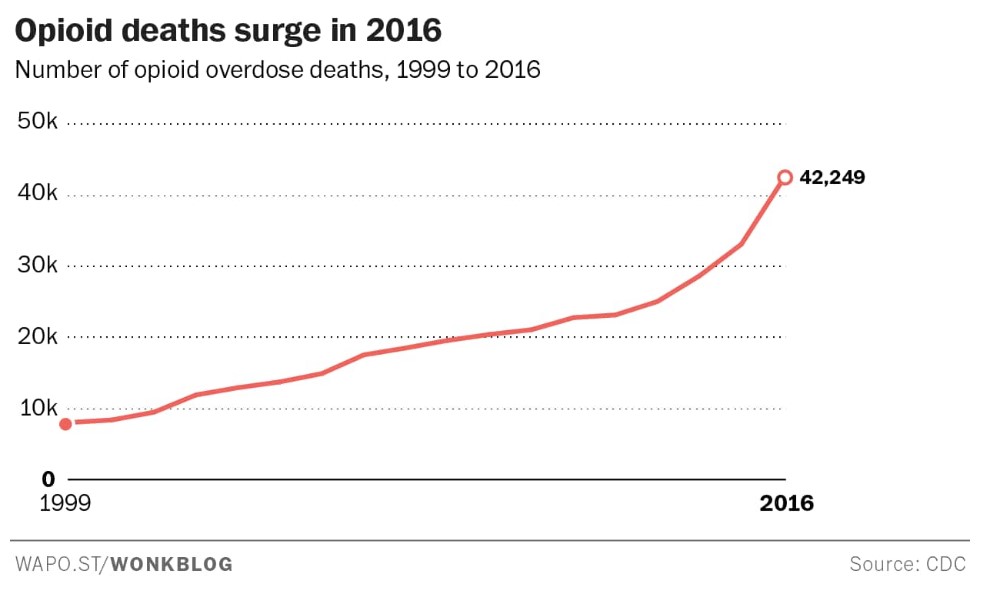
Fig. 2. Opioid deaths surge in 2016. Number of opioid overdose deaths by category, 1999 to 2016.
Source: Ingraham C. CDC releases grim new opioid overdose figures: ‘We’re talking about more than an exponential increase.’ The Washington Post, December 21, 2017. https://www.washingtonpost.com/news/wonk/wp/2017/12/21/cdc-releases-grim-new-opioid-overdose-figures-were-talking-about-more-than-an-exponential-increase/?utm_term=.f3f893febb8b
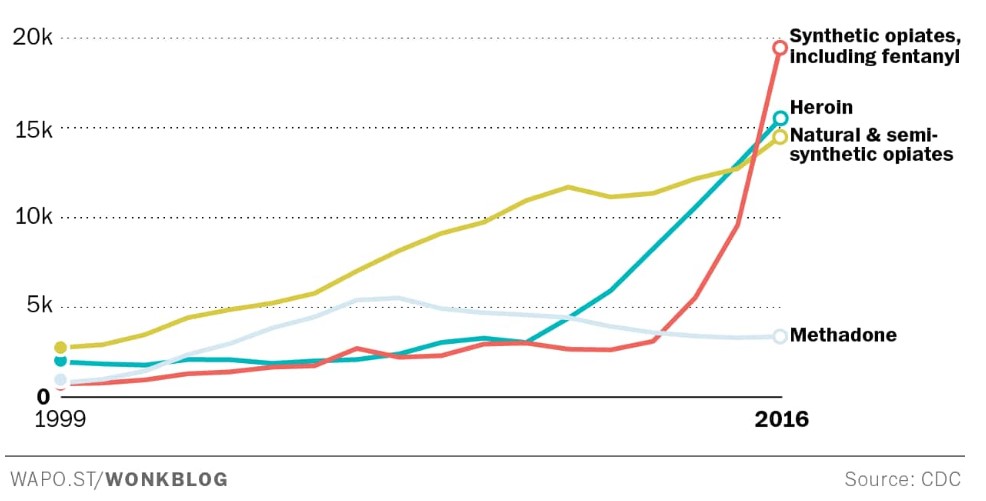
Fig. 3. Opioid deaths surge in 2016. Number of opioid overdose deaths by category, 1999 to 2016.
Source: Ingraham C. CDC releases grim new opioid overdose figures: ‘We’re talking about more than an exponential increase.’ The Washington Post, December 21, 2017. https://www.washingtonpost.com/news/wonk/wp/2017/12/21/cdc-releases-grim-new-opioid-overdose-figures-were-talking-about-more-than-an-exponential-increase/?utm_term=.f3f893febb8b